CASE STUDY 03 · 4 MIN READ
Sonia Abadi
A speaker’s ideas, made navigable.
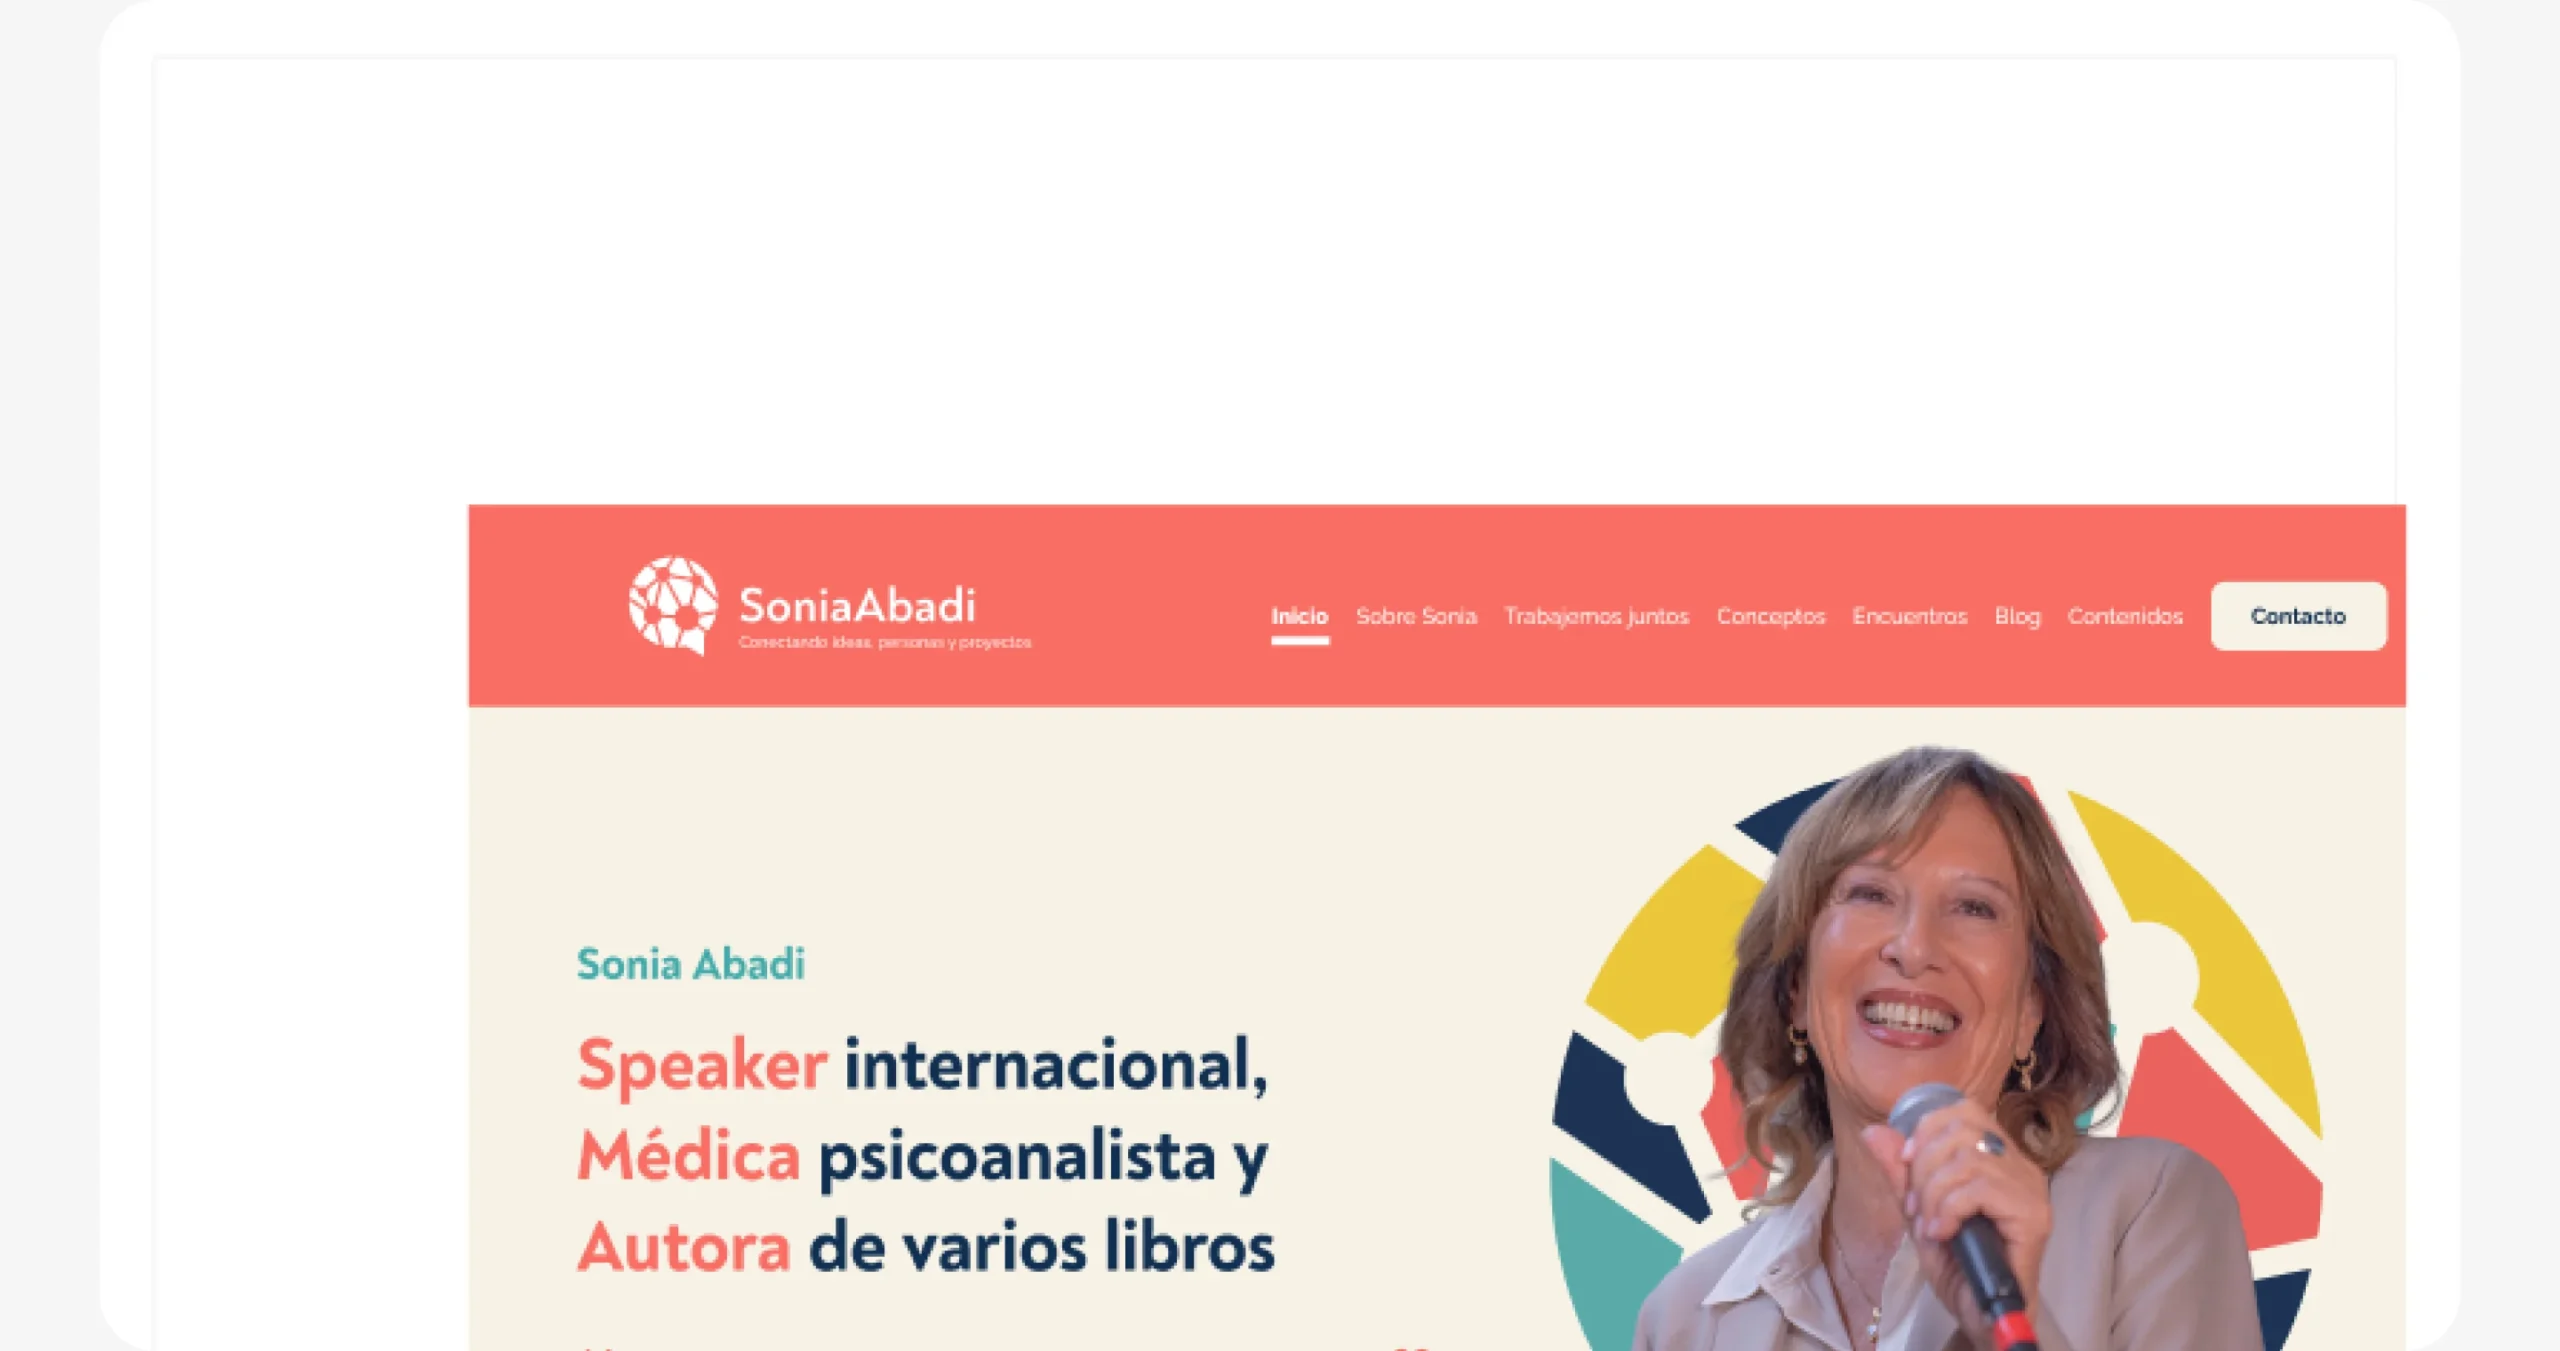
Sonia doesn’t just give talks. She connects ideas, people and projects.
Sonia Abadi is a psychoanalyst, international speaker and author, and the creator of “network thinking”. Her work lived in many places at once: conferences, books, courses, mentoring and a community. At Diwar Marketing I designed her new website.
The challenge
How might we bring talks, books, courses and a method together, so every visitor finds their way in?
Hypothesis
If visitors are sorted by what they want to do, not by format, companies will reach a booking and readers will reach her content in fewer steps.
How I work
I map the content before I draw, design around what people want to do, and build systems a team can keep using.
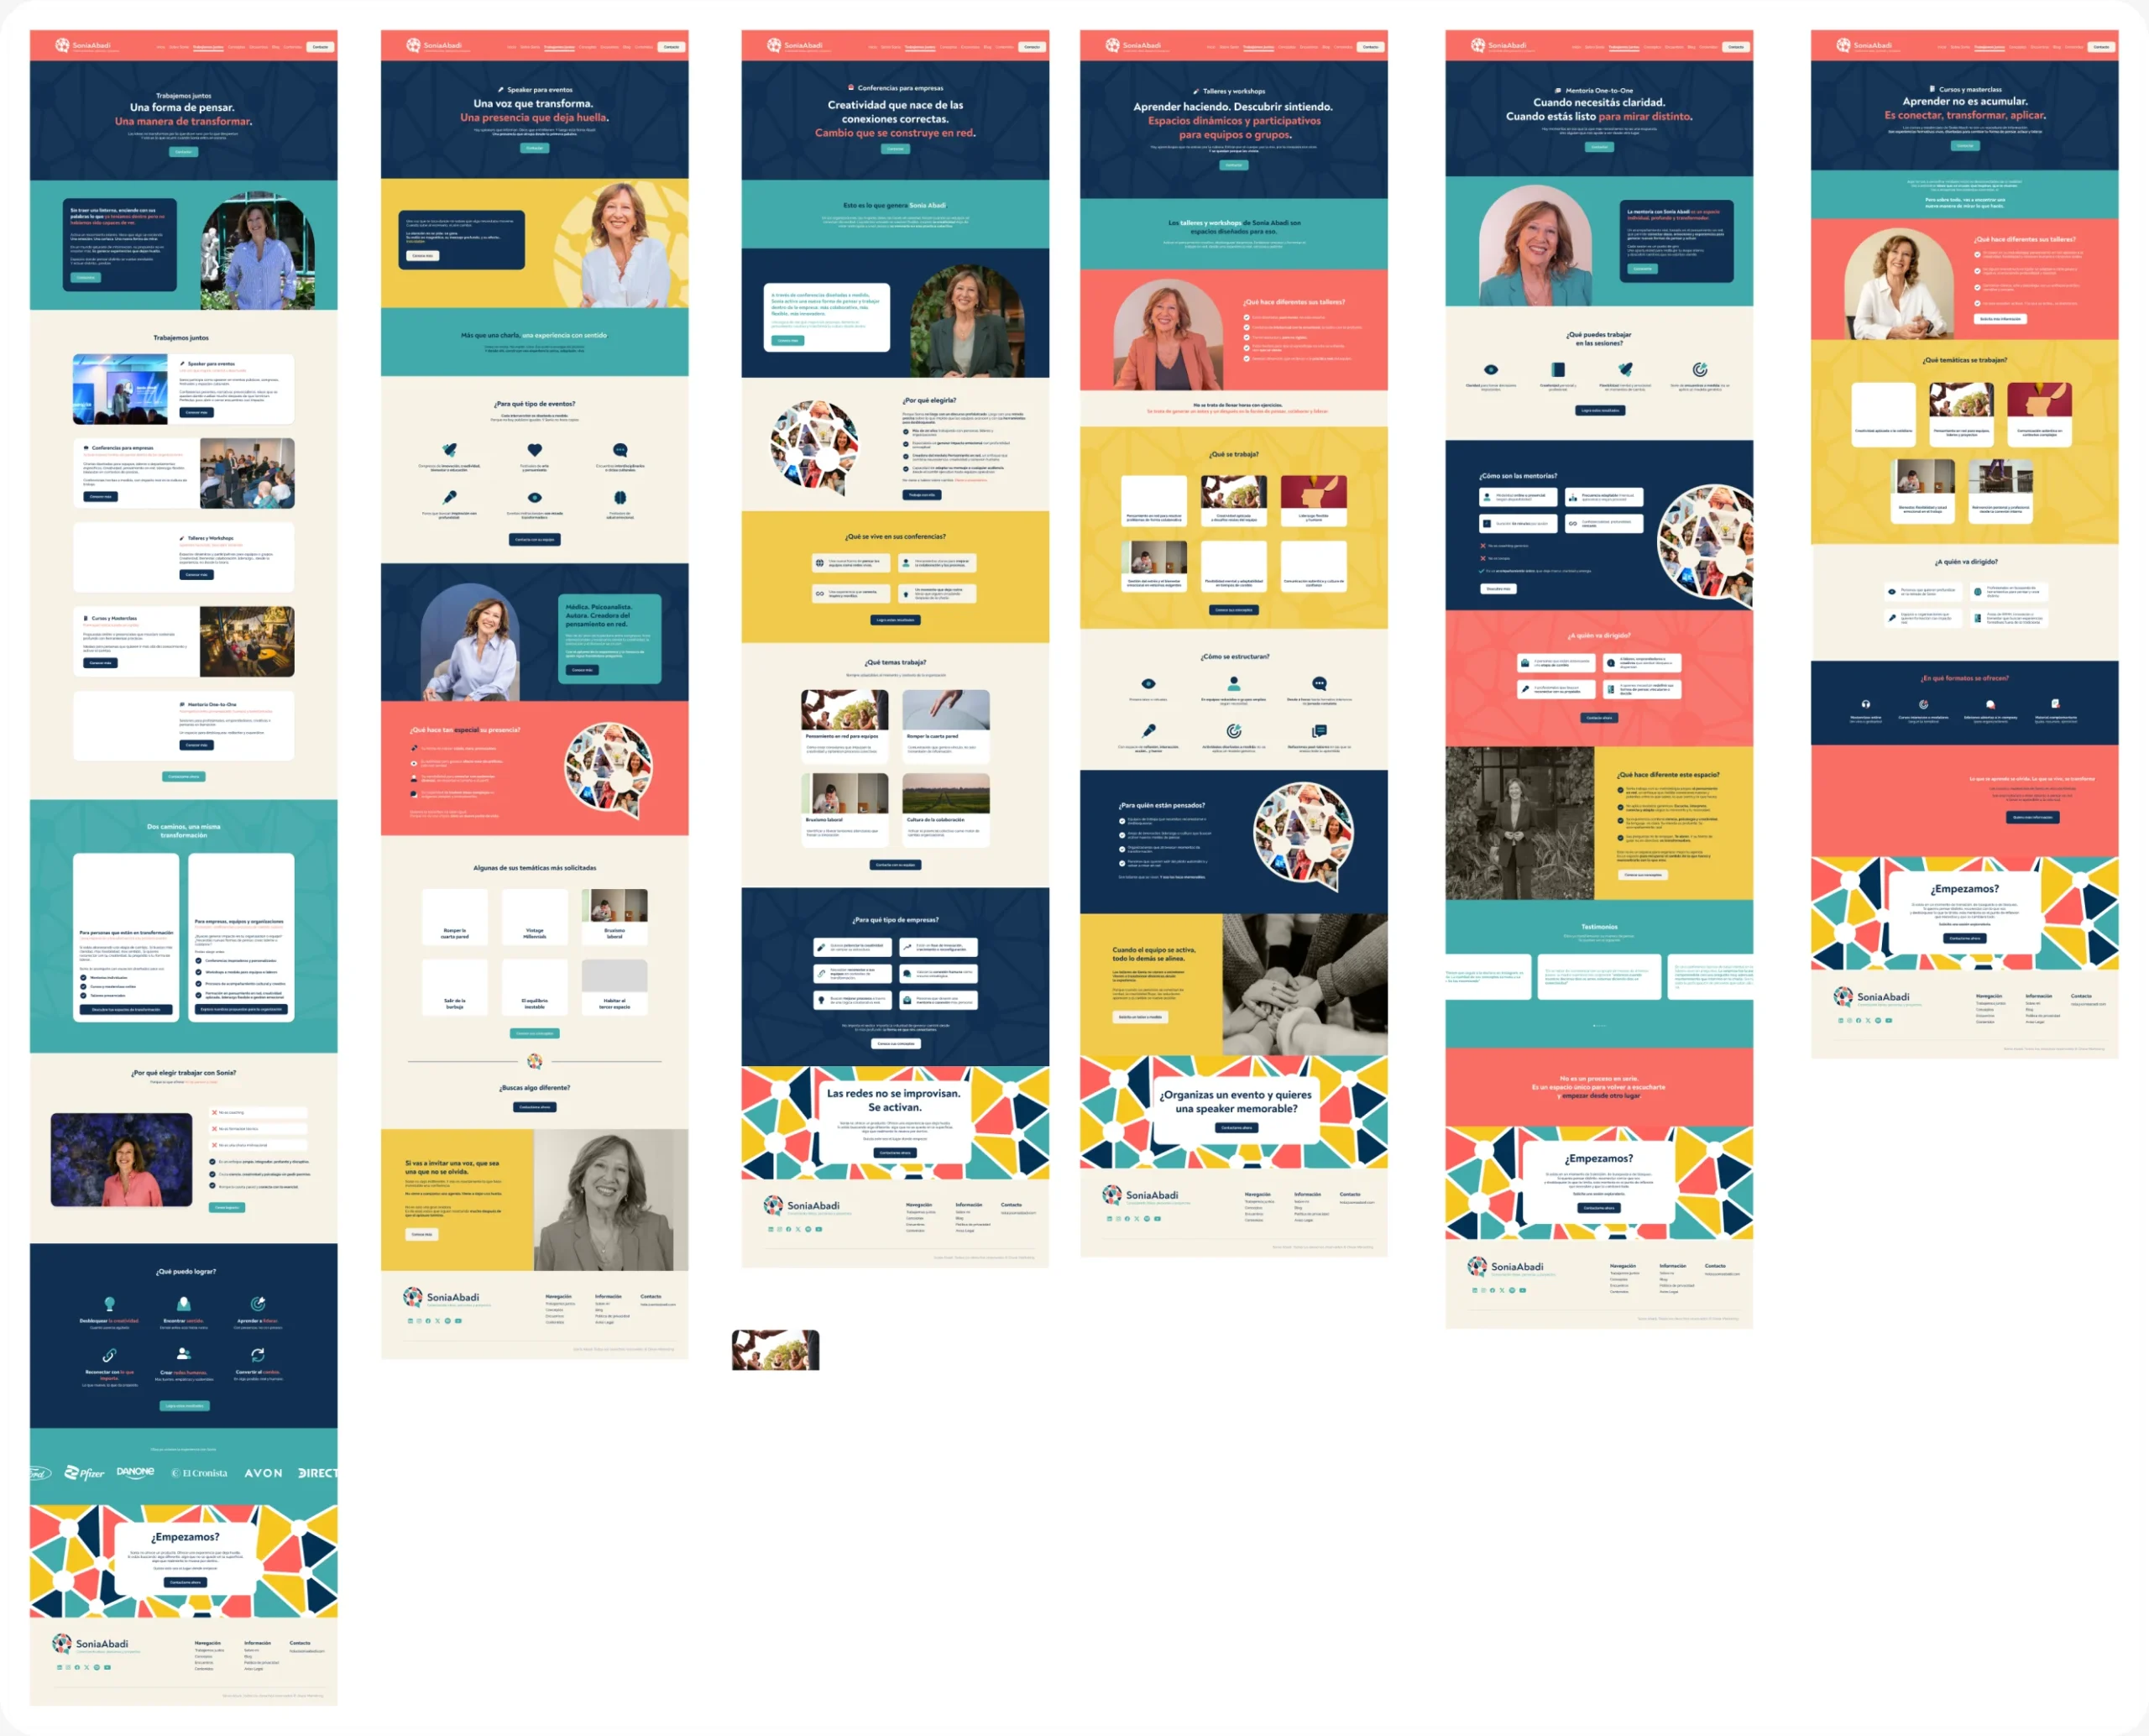
Every audience gets its own door. The home sorts visitors by intent, Work together turns companies into bookings, Content keeps readers coming back, and the brand graphics explain her method on every page.
Paths by intent, not by format
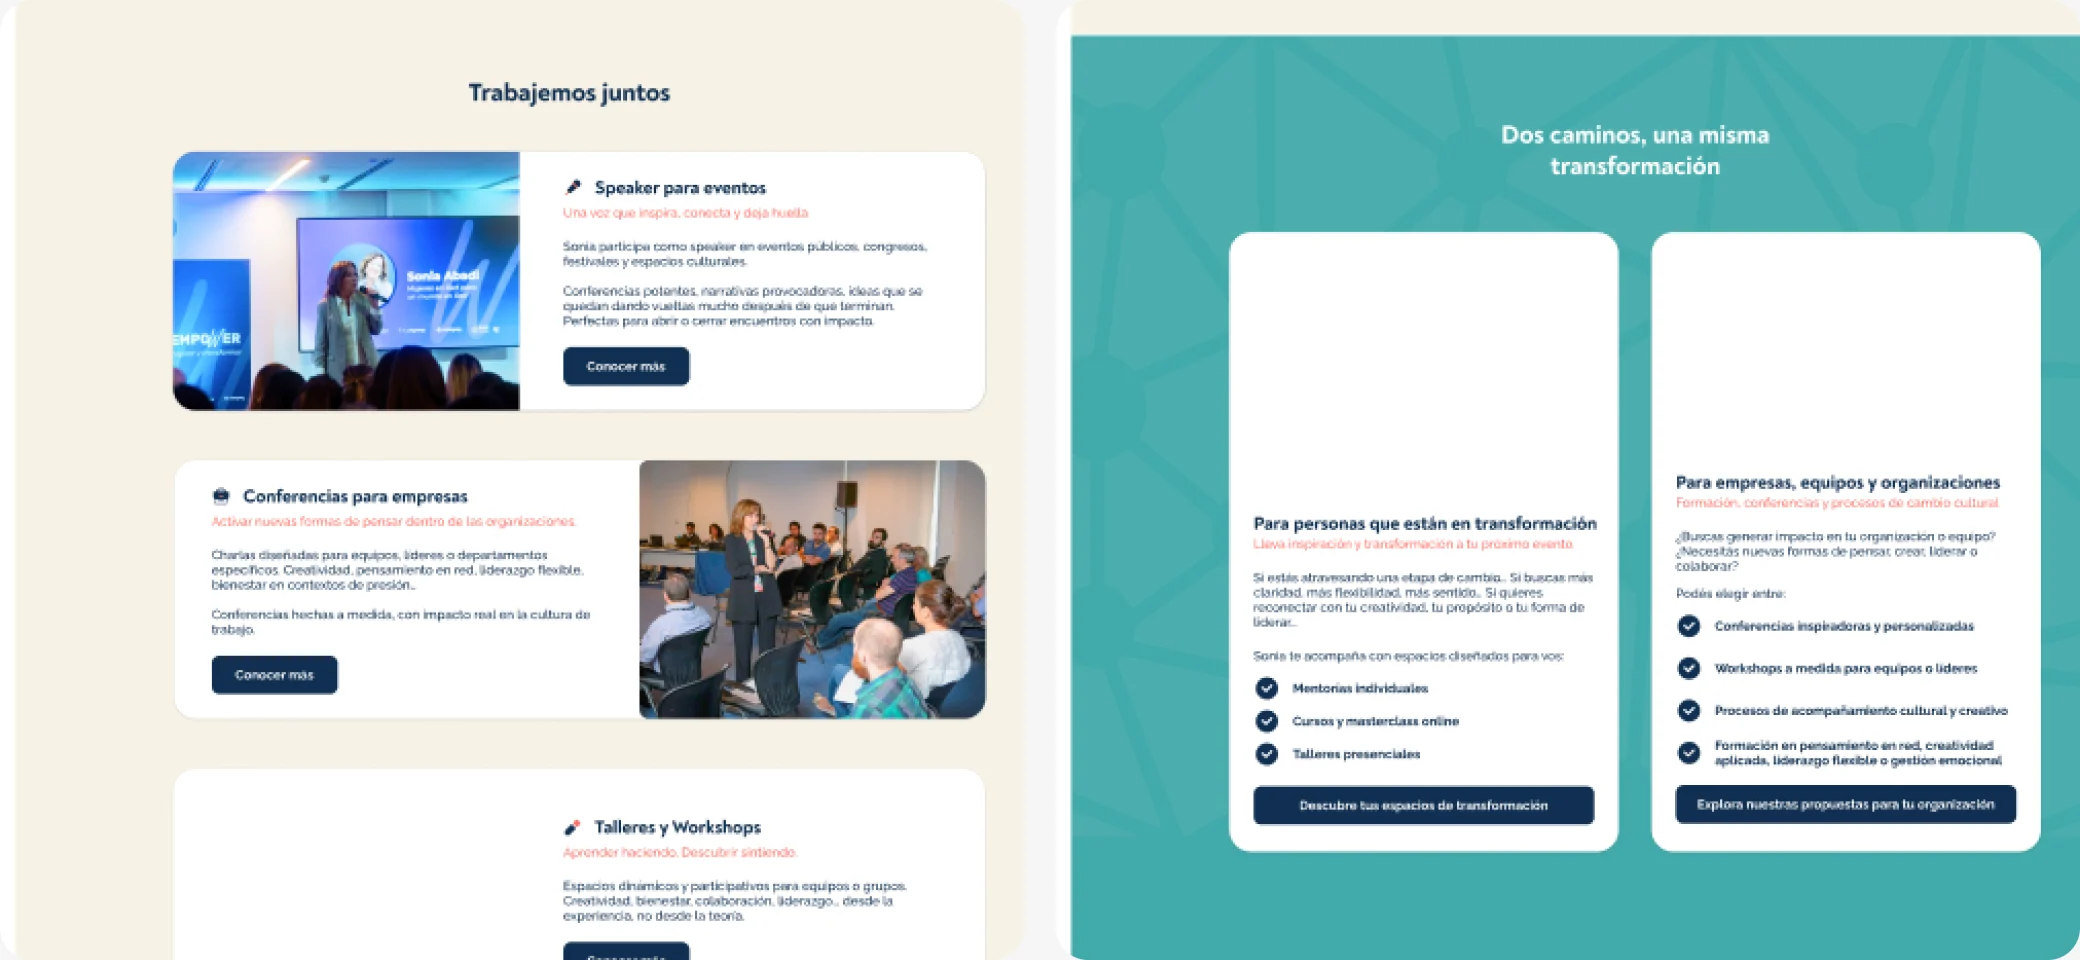
I considered organising the menu by format (talks, books, courses). I chose to split it by what people want: “Work together” for companies and organisers, “Content” for readers, and services that separate people from teams.
The sitemap
- Work together → Speaker · Conferences · Mentoring · Workshops · Courses
- About → Books · Who I am · Philosophy & method · Community · Press
- Content → Videos · Cartas en red · Resources · Talks
Why
A company booking a keynote and a student looking for a course should never have to go through the same page. Sorting by intent shortens every journey.
How I would measure it
Clicks from the home into each path, and how many companies reach the booking form. Tool: GA4 events.
Making the proof visible
Brands, universities and NGOs that worked with her moved from a hidden list to logo walls placed right where people decide: next to services and events.

Why
For a company, “Danone and Ford booked her” is more convincing than any description. Proof works best at the moment of decision.
How I would measure it
Booking requests from companies, and clicks on services placed next to the logo walls.
Her method became the visual language
Instead of decorating, the graphics explain her idea. The stained-glass mosaics are many pieces forming one picture, and the speech bubbles carry connection lines: a network of conversations.
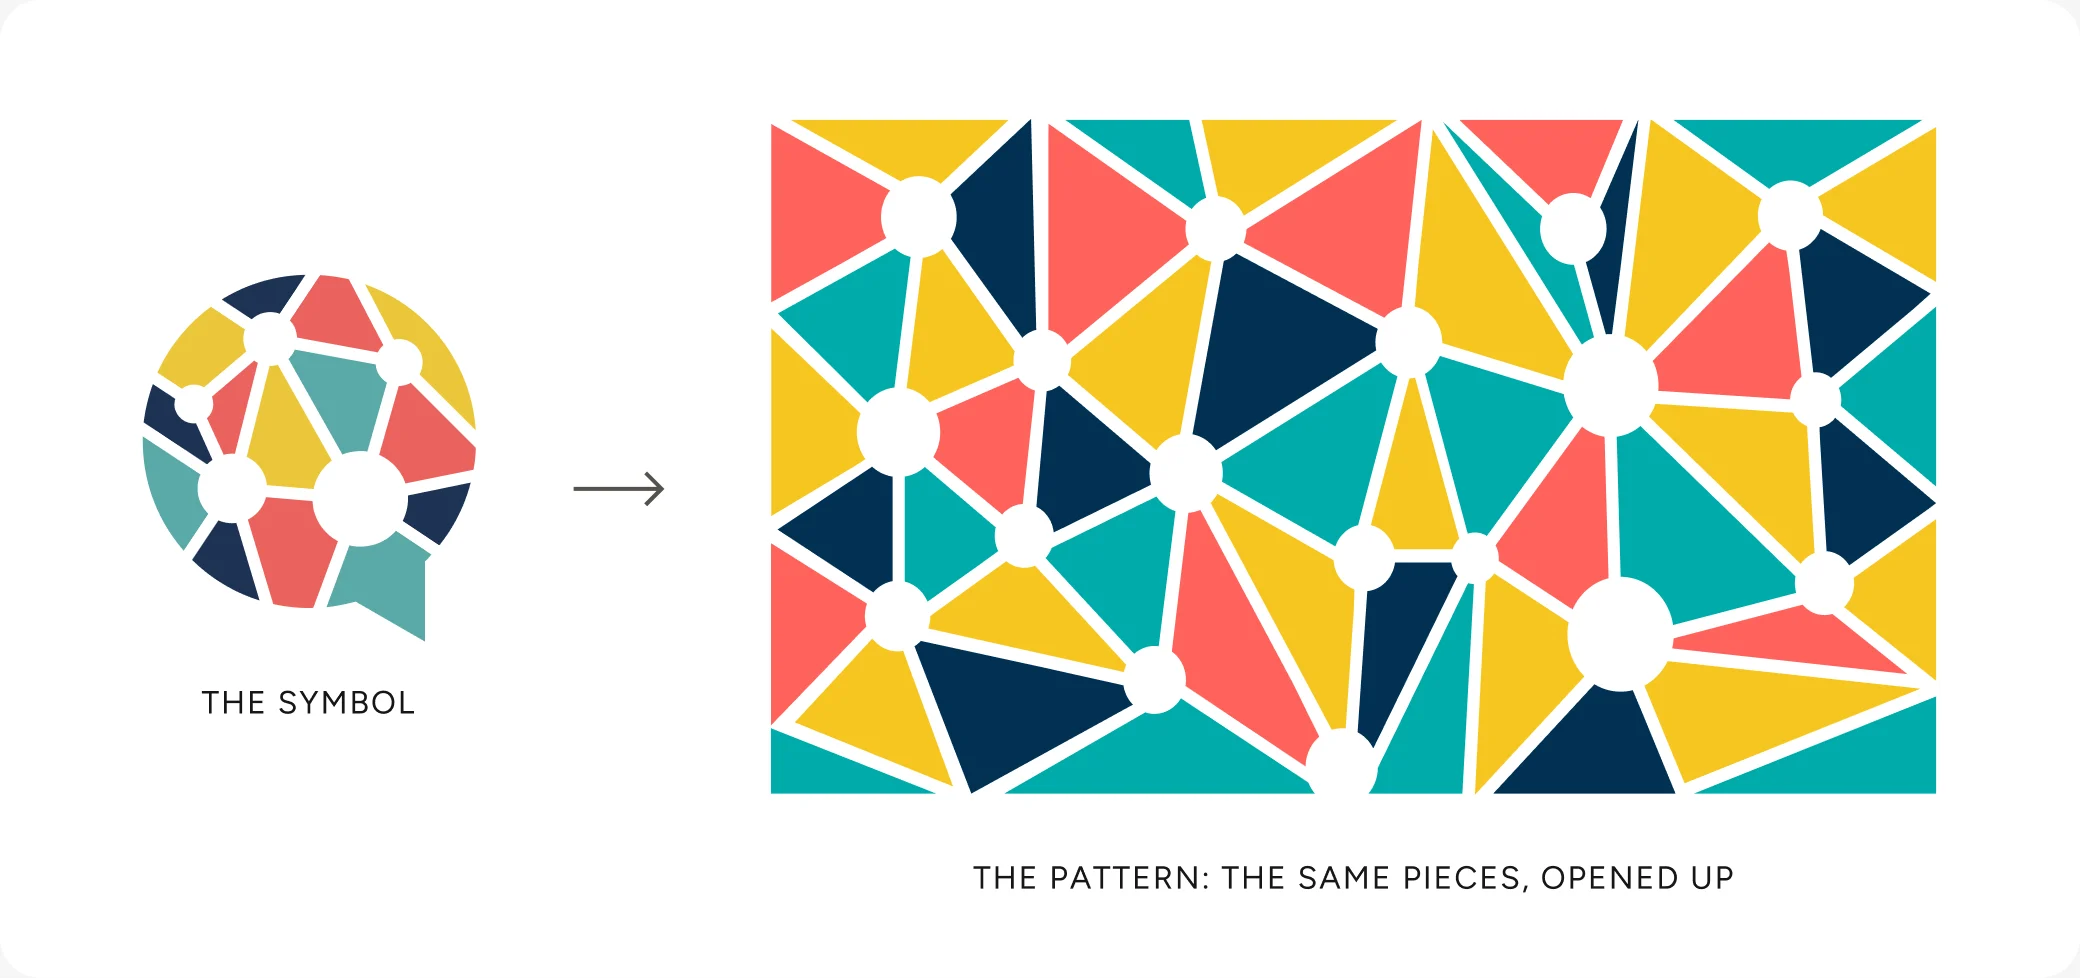

The logo is a speech bubble made of connected pieces: people in conversation. I opened it up into a stained-glass pattern, so the brand graphics grow straight out of the logo.
- Trust · navy
#013053 - Calm · teal
#41AAAA - Energy · coral
#FF625C - Warmth · mustard
#F6C621 - Space · cream
#F7F2E7
- Noah Text ExtraBold for headlines: round, bold and friendly
- Raleway for body: elegant and very readable in long texts
Why
A speaker who teaches “network thinking” shouldn’t have a generic site. When the visuals carry the concept, every page reinforces what she sells.
How I would measure it
A recognition test: after seeing the home, can visitors explain what network thinking is? Plus time spent on Concepts.
Why this work matters
Sonia’s site is live and the team keeps building pages with the system. These are the numbers that would prove it works.
00 → 00
Company booking requests per month, before and after the launch.
Speaker bookings
Requests from companies and organisers through Work together.
Clear paths
Can a first-time visitor say where to click for a talk, a book or a course?
System reuse
Pages the team built with the components after hand-off.
What I learned
Key takeaway
Working inside an agency taught me to design for hand-off: naming, components and documentation matter as much as the screens.
With more time, I’d…
- Test the menu with real visitors from each audience
- Measure which path companies use to book her
- Add a short “Which one is for me?” guide to the services
With less time, I’d…
Launch Home, Work together and Contact first, the paths that bring bookings, and add Content and Concepts in a second phase.
That’s the short version. The full process is below if you want the evidence.
- Companies & event organisers Want to book her as a speaker or run a workshop for their team.
- Readers & followers Want her books, articles and the “Cartas en red” newsletter.
- Professionals & students Want courses, masterclasses and one-to-one mentoring.
Understanding the space
Before drawing anything I benchmarked eight speaker and expert websites, from Spanish-speaking consultants to Tony Robbins, and noted what each one did well. Then I built a moodboard to agree the mood with the team.
What the benchmark told me
- The best sites show their main services right on the home, each with an icon or image.
- Proof matters: client logos, numbers and upcoming events build trust fast.
- Modular sections, rounded cards and strong headline contrast keep a lot of content easy to scan.
From structure to interface
I started in low fidelity to agree layout and hierarchy before adding the brand.
Low-fidelity wireframes, page by page, reviewed with the team.
A system the agency could keep building with
Many pages, several people. I documented reusable cards, buttons and images, and tracked every page as it moved into Elementor.
The system travels
Because the visual language was a system and not a decoration, it worked outside the screen too: event roll-ups, social reels, ebooks and presentations.
Feedback and iterations
Agencies rarely have time for formal testing, so I validate with what we have: client feedback rounds, team reviews and quick checks. This is what changed because of it.
How I validated it
- Feedback rounds with the client at each stage
- Weekly reviews with the senior designer
- Changes tracked page by page before handing over